介绍
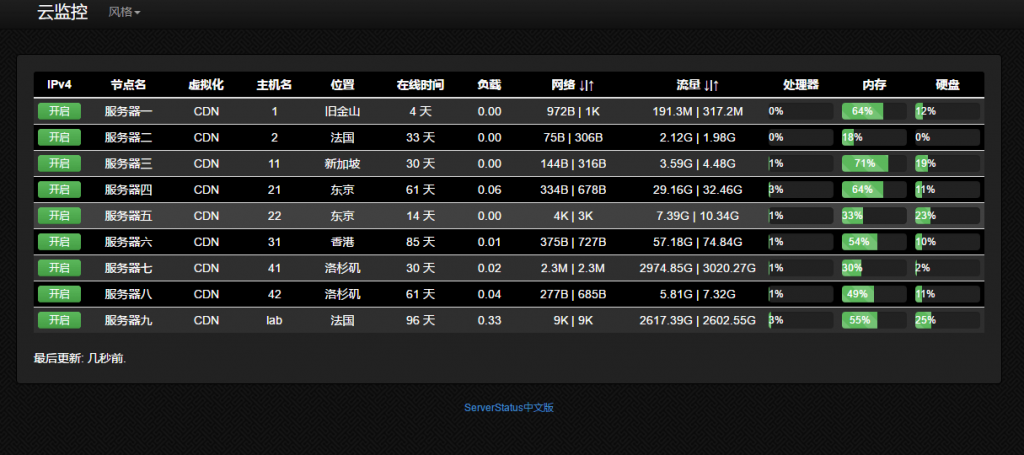
serverstatus 是非常优秀的服务器监控开源系统。非常直观。具体 demo 可以看: https://tz.cloudcpp.com/
如果你有多台服务器,特别是想监控带宽之类的常用指标,这个云监控非常好用。


中文版开源代码: https://github.com/tenyue/ServerStatus
我自用的代码: https://github.com/91yun/ServerStatus-1
我自用的代码修改了流量方面的统计,使用 vnstat 来统计月流量。有兴趣的朋友也可以自行看看。以下的教程是以 tenyue 的代码为准的,
安装服务器端
第一步:从 git 复制代码
git clone https://github.com/tenyue/ServerStatus.git
第二步:编译服务器端
如果编译出错,请安装编译依赖文件:
centos :
yum -y install gcc+ gcc-c++
第三步:编辑 config 文件
"type": "Dedicated Server",
"host": "GenericServerHost123",
"password": "some-hard-to-guess-copy-paste-password"
"type": "Dedicated Server",
"host": "GenericServerHost123",
"password": "some-hard-to-guess-copy-paste-password"
请注意确保每个子服务器的 username 是唯一
username :子服务器, serverstatus 通过这来辨识子服务器的身份
name :随意取个名字
type :文本,随意,一般是指“ VPS ”“独服”这种
host :文本,随意
location :文本,随意,一般填服务器所在区域
password :请确保 passwordd 和 username 是对应的,为了方便起见,可以所有子服务器的 password 是一样的,但是 username 必须唯一。
对应关系如下图:
第四步:把 web 文件拷到你自己的 web 访问的目录
cp -r ServerStatus/web/* /home/wwwroot/default
第五步:启动服务器端
./sergate --config=config.json --web-dir=/home/wwwroot/default --port=91
–config :配置文件地址
–web-dir:web 地址, serverstatus 会在这里生成 json 文件供网页调用
–port :监听的端口,默认是 35601 (注意服务器和被监控的客户端防火墙都要开相应的端口)
如果启动服务器端没问题,可以使用 nohup 后台启动
nohup ./sergate --config=config.json --web-dir=/home/wwwroot/default --port=91 &> /dev/null &
客户端的安装
安装依赖包
for Centos :
sudo yum -y install epel-release
sudo yum -y install python-pip
sudo yum -y install python-devel
for Ubuntu/Debian:
apt-get -y install python-setuptools python-dev build-essential
apt-get -y install python-pip
for Windows:
打开网址: https://pypi.python.org/pypi?:action=display&name=psutil#downloads
下载 psutil for windows 程序包
安装即可
下载客户端代码并修改配置
github 提供了 2 种客户端的 python 文件,建议使用 client-psutil :
wget https://raw.githubusercontent.com/tenyue/ServerStatus/master/clients/client-psutil.py
修改 SERVER 地址, username 帐号, password 密码
USER = "这台服务器的username,对应服务器config.conf文件的username"
PASSWORD = "密码,也是对应服务器config.conf文件的password"
后台运行客户端代码
如果客户端没有出错的话,那么可以使用 nohup 后台运行的方式启动